Etude
Slow Slide? Europe’s Largest Banks Face Eroding Financial Positions
Slow Slide? Europe’s Largest Banks Face Eroding Financial Positions
Investors may be overly optimistic about banks with relatively weak balance sheets.
Etude
Investors may be overly optimistic about banks with relatively weak balance sheets.
European banks are benefiting from investor enthusiasm—and perhaps a dollop of overoptimism. By the end of 2017, investors raised their valuations for European banks, on average, from the previous year: The asset-weighted price-to-book ratio of their stocks rose from 0.82 in 2016 to 0.92 at year-end 2017. And investors have been increasingly and disproportionately tolerant of banks with relatively weak balance sheets, whether because they were reassured by recent recapitalizations or because they have not found better alternatives for their money.
Higher valuations might be a prudent direction, on average, but greater risks emerge when one decomposes the average to analyze the situation by bank size and categories of health. The positions of the different banks highlight the polarization of banking in Europe, where there is no homogeneous banking system.
Notably, on average, the largest European banks have lost ground in both profitability and capital position relative to the sector as a whole. They have been on a downward trajectory for several years—a trend that could spell trouble for investors and the broader financial system.
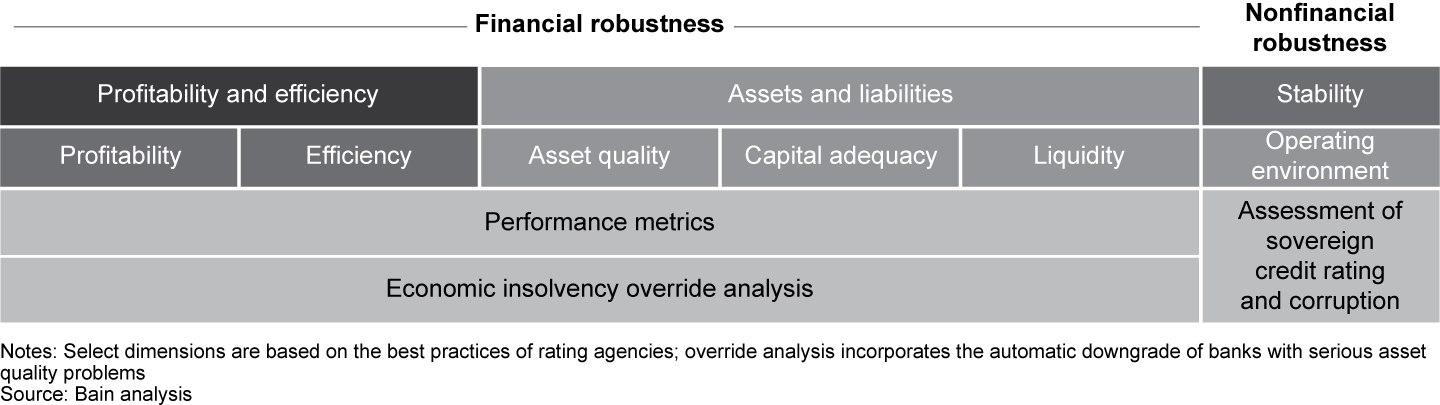
These conclusions emerge from Bain & Company’s 2018 health check of the banking system, the fifth annual analysis, covering 100 banks in the base study. Our health check scoring model derives from three dimensions, two of which represent banks’ robustness (see the sidebar below "How the scoring model works"):
Our scoring brings together data from financial providers such as SNL Financial and Moody’s and combines their findings with banks’ own financial statements. The health check provides a uniquely integrated view, which stands in contrast to looking only at a balance sheet or income statement. Based on the combination of the critical financial ratios, we calculate a score for each bank and place it in one of four categories (see Figures 1 and 2).


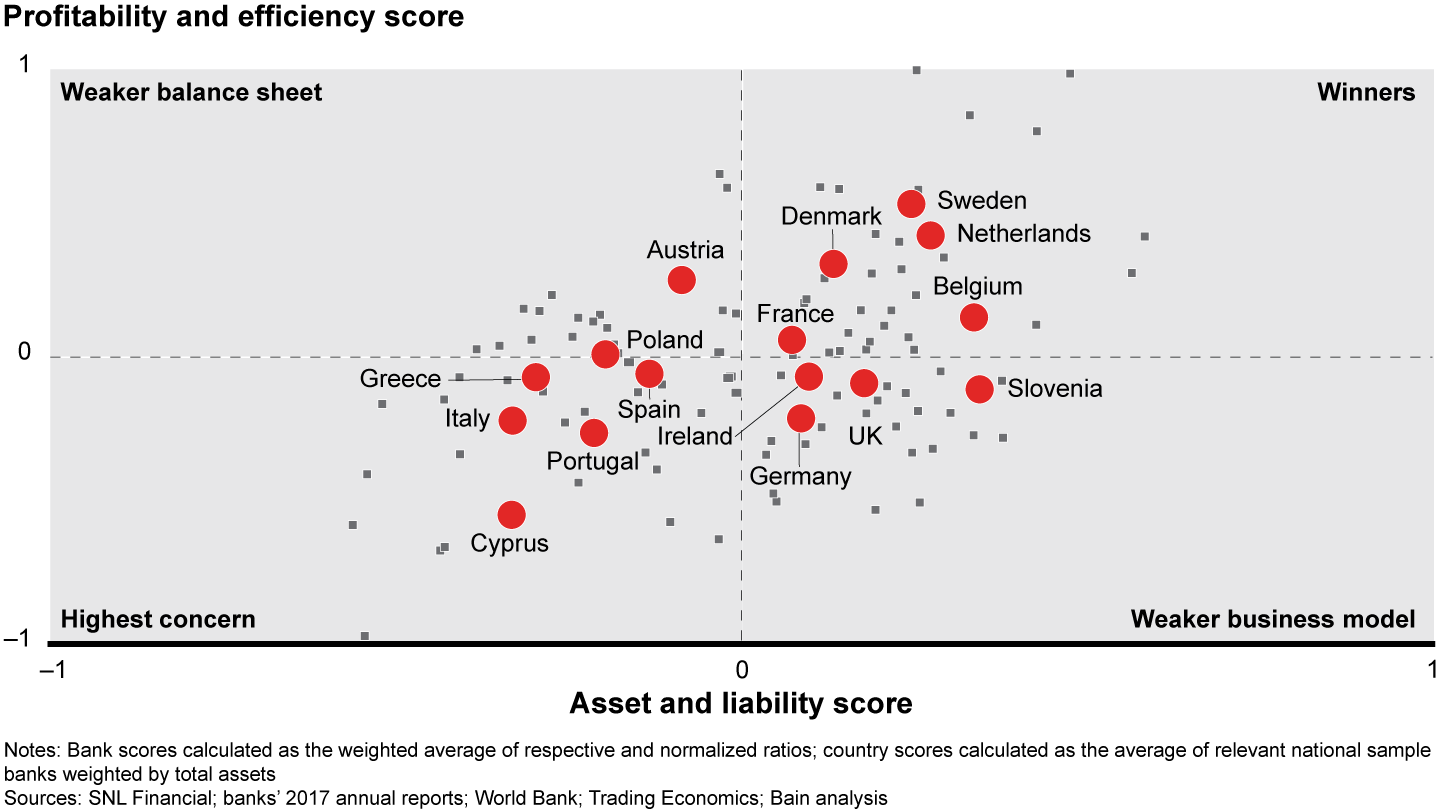

Stepping back to look at the entire base of banks, we see several broad trends.
First, profitability and efficiency indicators improved across the board. Net income as a share of risk-weighted assets increased by 0.3 percentage points, to 1.1%. Continued strong underlying economies in most countries helped banks in this regard. In addition, the median cost-to-income ratio dropped 3 percentage points, to 60%, although German and UK banks continue to lag the sector.
Capital adequacy and asset quality measures improved as well. Tier 1 capital rose by 1 percentage point, to 16%, and tangible common equity as a share of risk-weighted assets rose by 3 percentage points, to 17%. Median asset quality improved, as problem loans declined by 1.1 percentage points, to 4.2%, and loan-loss provisions dropped by 0.1 percentage points, to 0.2%. Banks also improved their liquidity, with the loan-to-deposit ratio dropping from 116% to 111%.
João Soares, a partner with Bain's Financial Services practice, outlines a proven formula that can help any bank become a winner in three to five years.
Homing in on the largest banks, we see a greater cause for concern. Of the top 10 banks by assets, only one improved its financial position during the year; all others suffered a decline in financial health and resilience relative to the sector as a whole (see Figure 3) . If the top 10 were one institution, they would be in the weaker business model category for every year since 2013.
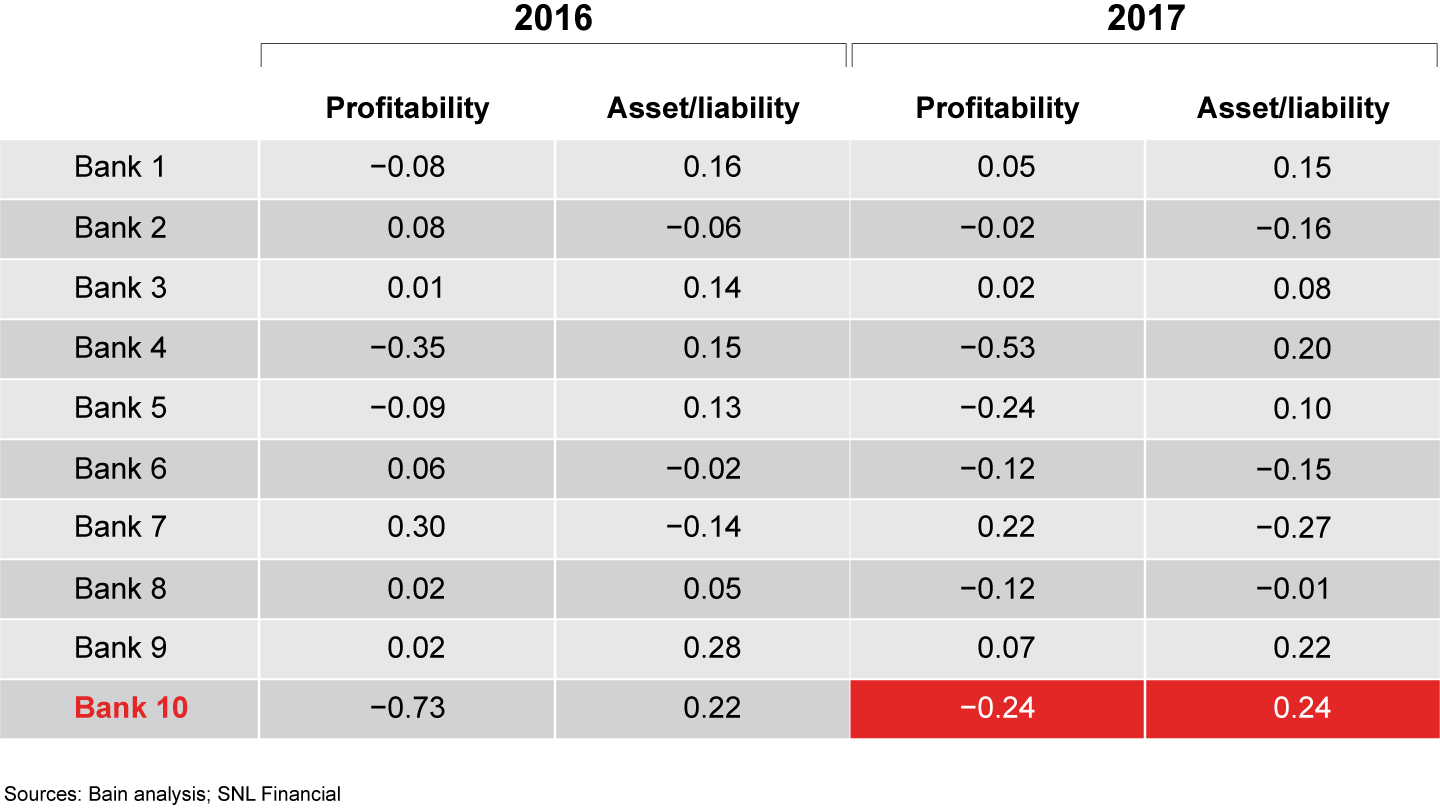

The biggest percentage-point difference between the largest banks and the rest occurs in the cost-to-income ratio, in which the median for the 10 largest is 69%, compared with 60% for other banks. A higher cost-to-income ratio hurts their ability to compete by forcing them to pay relatively more for inputs to drive returns rather than generating capital.
On the other hand, the largest banks have a higher loan quality, on average, with 2.5% of loans deemed problem loans, compared with 5.1% for the other 90 banks. Higher-quality loans mean lower provisioning costs, which helps offset high operating expenses and boosts profitability.
And how have investors responded? They pushed up the average price-to-book ratio of the top 10 to 0.86 in 2017 from 0.77 the prior year. Meanwhile, the ratio for the rest of banks rose to 1.01 from 0.89. Each group earned similar growth in valuation, despite large banks’ declining relative position.
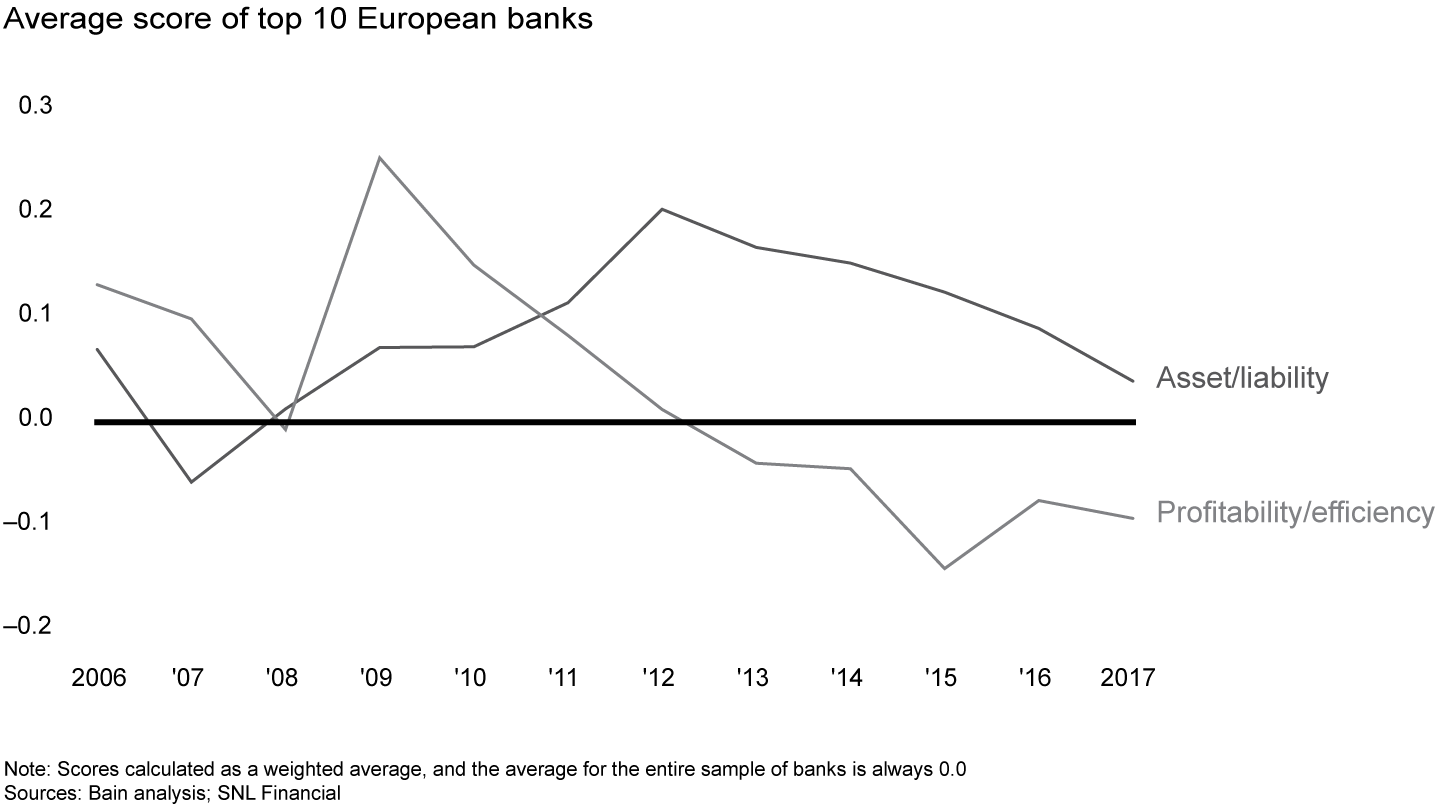
In aggregate, the top 10 have been moving down for between five and eight years, depending on the metric examined (see Figure 4) . Larger banks once had relatively stronger balance sheets than small ones, but that gap has greatly diminished. The large banks continue to be profitable, on average, which suggests they are either masking their balance sheet problems or trying to ride them out. With the risk of a recession increasing, though, the music could soon stop, and there will be no chairs left to grab.

The experience of the only large bank that managed to improve its financial position is instructive. Coming out of the financial crisis, similar to many other banks, this one attacked the easily identified costs. It went further, however, by rebasing the budgets of many functions and departments.
In tandem, the bank has invested substantially in customer-friendly digital technologies, including a mobile app that has won praise from consumers, and thus migrated more routine transactions to lower-cost, self-serve channels and away from high-cost branches.
The bank also simplified its value proposition in several respects. It pared down product lines to keep only products that would enhance the experience of target customer segments, rather than trying to offer broad lines for their own sake. The bank shed many noncore assets and businesses, such as downsizing investment banking in the UK, in order to focus on retail and commercial banking there. It also doubled down on being a strong franchise (No. 1 or No. 2) in its key markets.
Customers have responded favorably to its simple digital tools, thoughtful cost reduction and sharper focus on key markets after the crisis. The bank saw its home market Net Promoter Score ®, a key metric of customer loyalty, rise by 6 points in 2017, which was the third-highest increase among 14 banks in the country.
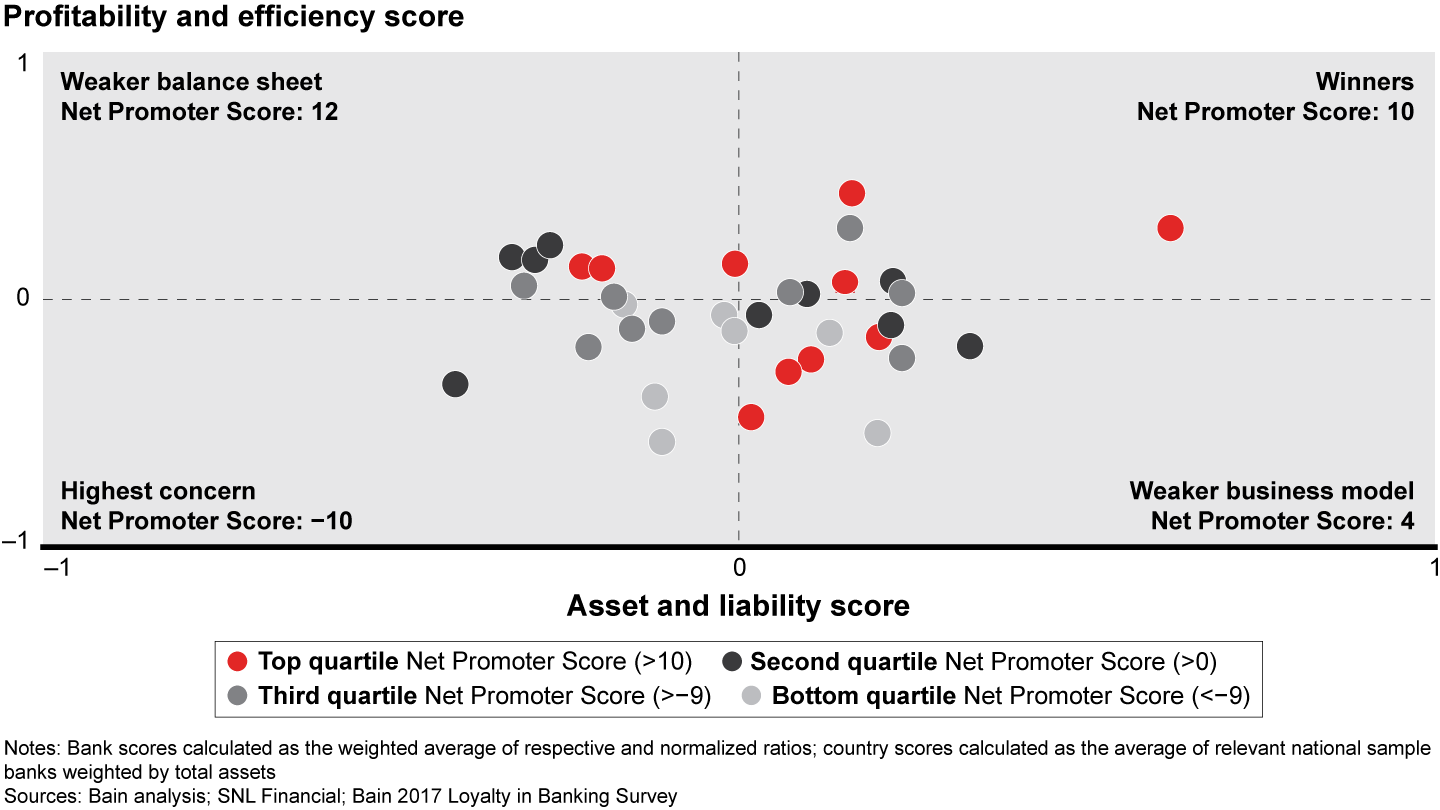
Indeed, loyalty and financial health are closely intertwined. Banks in the winners category have a weighted average Net Promoter Score 20 points higher than the highest-concern banks (see Figure 5) . It should come as no surprise that banks that invest in better identifying and addressing their customers’ needs, in solving their problems, and in making banking simple and digital are winning. What may be surprising is how analytical, focused and deliberate these improvements can be. No one size fits all, but clearly, there is a right size that every bank can work toward.

The scoring model in Bain’s health check of the banking system gathers data in six areas, with the heaviest weighting on asset quality (see figure below).
Profitability: The key determinant of sustainable success or failure, it measures the ability to create economic value and to preserve or improve risk protection for creditors. Performance metrics include preprovision income as a percentage of risk-weighted assets and net income as a percentage of risk-weighted assets.
Efficiency: Cost containment is a strategic focal point; it allows banks to satisfy stakeholders’ requirements without overly aggressive risk taking. Performance metrics include operating expenses as a percentage of net revenue.
Asset quality: A main factor in future earnings and capital generation or erosion, loan quality is a key to determining a bank’s stability. Nonperforming loans predict future losses. Performance metrics as a percentage of gross loans include problem loans, loan-loss provisions and corporate loans.
Capital adequacy: Banks typically fail due to losses in the loan portfolio, poor business models or fraud—all of which lead to a decline in capital. In the case of low profitability, capital is the most important buffer for absorbing risk costs. Performance metrics include Tier 1 capital as a percentage of risk-weighted assets and tangible common equity as a percentage of average risk-weighted assets.
Liquidity: Illiquidity is often a proximate cause of failure as banks might not any longer be able to finance themselves under pressure. Access to market funding may not be based on long-term relationships but rather on creditworthiness. Performance metrics include gross loans as a percentage of total deposits and total debt—that is, liquid assets as a percentage of total assets.
Operating environment: Bank performance is often constrained by violent economic cycles, adverse political decisions or weak legal systems. Declines in economic growth correlate highly with worsening asset quality. Performance metrics include assessment of sovereign credit rating and corruption.
João Soares is a partner with Bain & Company’s Financial Services practice. He is based in London. The author thanks Justyna Nowicka for her contribution to the European health check analysis and to this brief.
Net Promoter®, Net Promoter System®, Net Promoter Score® and NPS® are registered trademarks of Bain & Company, Inc., Fred Reichheld and Satmetrix Systems, Inc.

Bain Partner João Soares discusses the state of banking in Europe and how customer loyalty has become a key success factor for winning banks.
