Expert Commentary

Companies often group their demand series according to a business or organizational structure, such as a planning hierarchy or reporting hierarchy. Although this type of grouping is easy to organize and report, it is poorly suited for modeling purposes. Instead, companies should think about demand series from the perspective of demand signals and classify them accordingly to better understand them and guide the forecasting process.
Special demand signals
There are three special demand signals. Depending on the application, these might require a modeler to handle each in a special manner or ignore them by applying a simple method that improves the computational performance.
- Retired product series. Sometimes demand series for discontinued products remain in the system. The expected forecast behavior should either filter out these series or generate zero or missing forecast values. The decision on whether to include these series in the modeling process depends on the case. For an important product or when this series can provide useful information to substitute products, the series should be included in the modeling process after adjustment.
- New product series. Examples include a new product in an existing store, an existing product in a new store or a new product in a new store. The series usually has limited historical observations for modeling, and its use will depend on the application. For example, an assortment planning or pricing project might require new product forecast methods such as attribute-based models or life cycle analysis.
- Extremely low-demand series. For demand with small values at relatively low frequency, such as demand for special machinery or some luxury products, the historical pattern alone will be hard to model. A critical series—say, products with high margins—might require modeling with additional explanatory variables to capture demand occurrence signals or borrowing information from other series. Otherwise, values from complicated models cannot exceed those from the simple average.
Regular demand signals
Regular demand signals can be classified in two ways.
First, using a business- and project-planning perspective. By classifying demand based on volume, which indicates importance, and volatility, which indicates forecastability, we can classify the demand series into four categories and prioritize the forecasting efforts (see Figure 1).
Figure 1
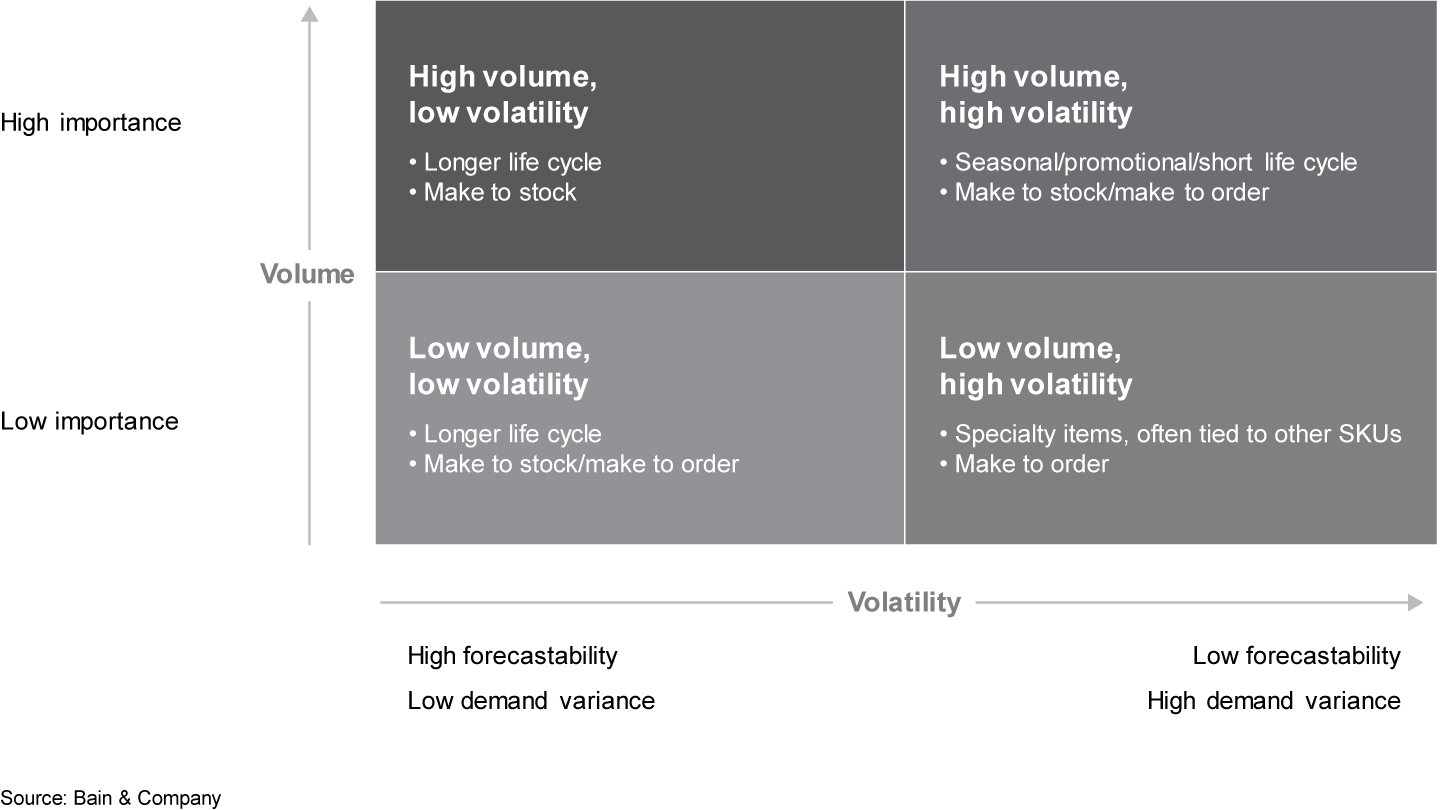

Usually, high volatility indicates low forecastability. Sometimes, the volatility of the original demand series does not directly serve to measure the forecastability, however, because highly seasonal series, such as one with a sine curve, are highly volatile but not hard to forecast. A more reasonable gauge of volatility in forecasting should be the volatility of the residuals from the benchmark model.
The advantage of this classification is that it helps to prioritize the forecasting tasks. For an operational level forecast, there are usually thousands of demand series, too many to monitor. It’s more effective to focus on the high-volume, high-volatility class first, since improving forecast accuracy for this category yields the most value. Then we can focus on the high-volume, low-volatility category next, with the low-volume, low-volatility category after that and the low-volume, high-volatility category last.
Using Pareto’s 80/20 principle, the four classes should be easy to manage and interpret. You can also split each dimension into three categories instead of two so that it has nine classes, similar to ABC/XYZ classification, with a slightly different measurement of volatility. Companies often use ABC/XYZ classification in supply chain management.
Six categories for demand series
Depending on the demand cycle pattern, seasonality and volume, we can classify demand series into six categories (see Figure 2).
Figure 2
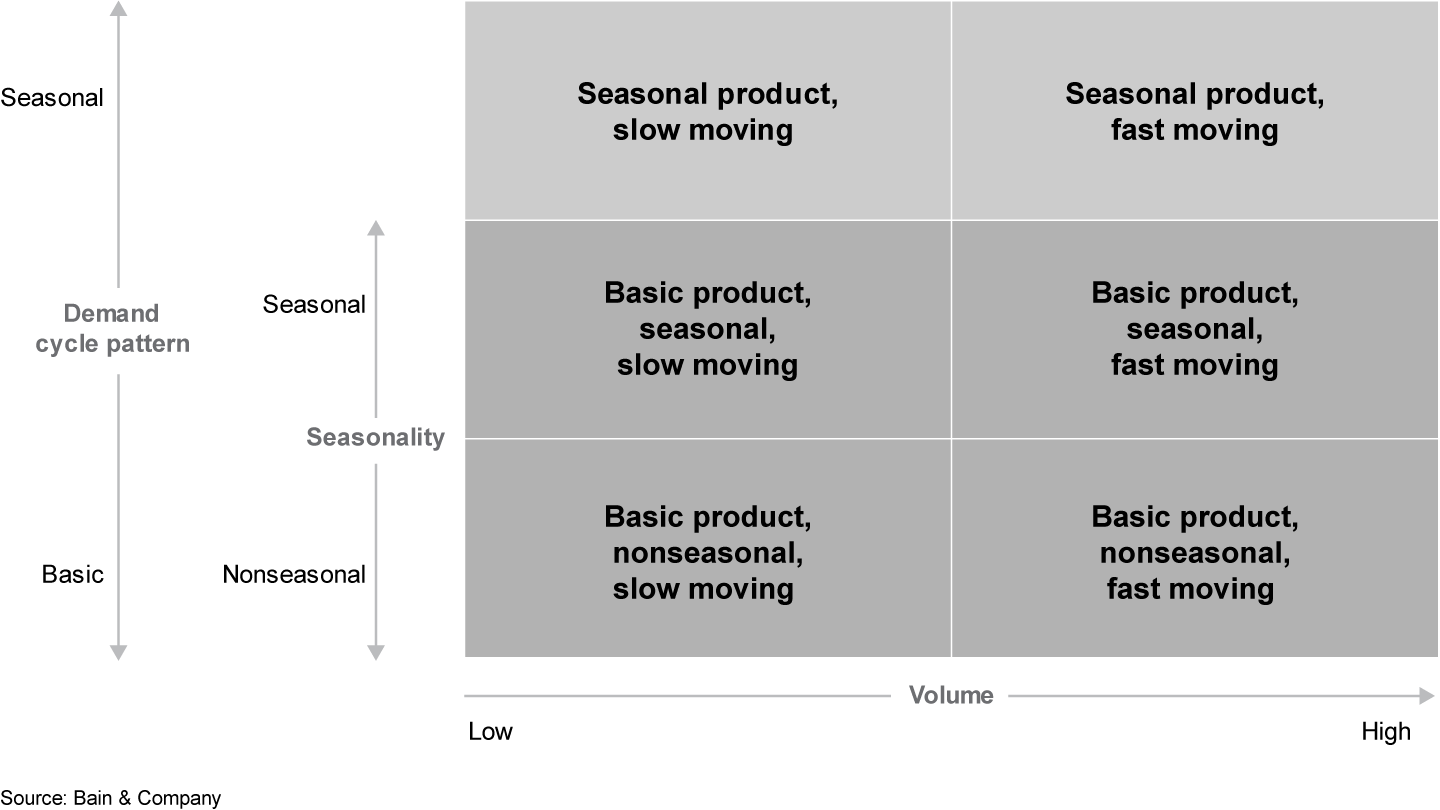

Each class has different demand signal patterns that can help with model selection. For example, slow-moving series, also called intermittent demand series, might require intermittent demand models or a probabilistic forecast model in order to understand the special distribution of the demand. Seasonal product series, which have big demand gaps during the off-season periods, require models that can handle that pattern, so we might model with a customized time interval or a regression-based model with interval indicators.
We can use the six categories to diagnose problems with existing forecast results. For example, we might find that a forecasting team encounters issues with some of the products or regions. This classification method can help identify the common characteristics of such series and improve upon them.
The classification method serves to improve business insights and build trust in the forecast. For example, when working with seasonal product series, such as demand for wood stove accessories, many forecasting models will generate some small, nonzero forecast values for the off-season part of the series. Although the forecast accuracy for these models might be good, it does not make sense from a business perspective because one might not trust a forecast that predicts demand for wood stove accessories during the summer. With the demand pattern in mind, we can avoid such mistakes and build trust in the forecast.
The classification method can also guide consideration of the downstream decision process. For example, extremely low-demand series, slow-moving series and fast-moving series imply different demand distributions and models for inventory optimization. Therefore, it makes sense to consider them separately during the forecasting process.
In summary, classifying demand series can help facilitate forecasting tasks by focusing time on high-value cases, understanding the data, identifying forecasting problems, selecting forecasting models, building trust in the forecast and guiding the forecast process.
Yue Li is an expert with Bain & Company’s Advanced Analytics practice. She is based in Los Angeles.

Advanced Analytics Expert Commentary
Success with advanced analytics requires both technical know-how and a thoughtful approach. In this series, Bain's experts offer practical advice on some of the most common data issues.
First published in agosto 2019